From time to time we are asked by the users of MoSKito, how to do this or that, and how to implement a specific use-case with MoSKito. This is why we started a recipes section in our documentation and now also on the blog. A recipe will describe how to achieve a specific goal.
So the original question which led to this recipe: “Lets say I have a process, some kind of job, which is running every x seconds, and I want to monitor the number of successful and unsuccessful executions, with least possible effort”. And here how it goes.
Setting up the example
First of all we created a simple example that demonstrates what happens here. The example can be found under module recipe in moskito-demo github repository under: https://github.com/anotheria/moskito-demo/tree/master/recipes/counter. First of all there is our daemon worker:
public class Daemon {
	public static void main(String a[]) throws Exception{

		//since we are running in now container, we need to enable moskito by hand. This is not needed in a webapp or another environment if you already have moskito running.
		StartMoSKitoInspectBackendForRemote.startMoSKitoInspectBackend(9401);

		ScheduledExecutorService service = Executors.newSingleThreadScheduledExecutor();
		//perform the task every 2 seconds.
		service.scheduleAtFixedRate(new Job(), 0, 2, TimeUnit.SECONDS);
	}
}
Note, that the manual starting of MoSKito Backend is only required, because the example is stripped to the minimum, it wouldn’t be required in a web-app, or with moskito-javaagent etc. Apart from that the Daemon just submits a new job to an executor service. So forward to the job code:
public class Job implements Runnable{

	//this is the annotation based counter, based on moskito-aop.
	private static Counter counter = new Counter();
	private static Random rnd = new Random(System.nanoTime());

	@Override
	public void run() {
		int result = rnd.nextInt(10);
		boolean success = result < 8;
		System.out.println("Executing job, result "+result+" success: "+success);
		if (success){
			counter.success();
		}else{
			counter.error();
		}
	}
}
So after determining if our execution is a success or a failure, all we gonna do, is to call a method in a Counter. This Counter must be a magical class, right? No actually it is not:
@Count(producerId = "ProcessCounter")
public class Counter {
	/**
	 * Call this method when the process has been successful.
	 */
	public void success(){}

	/**
	 * Call this method when the process has finished with an error.
	 */
	public void error(){}
}
So our counter class is just an ’empty’ class with two marker methods. And an annotation: @Count. This forces MoSKito to count all requests to every method in this class. I already wrote about counters a while ago: http://blog.anotheria.net/msk/one-to-count-them-all/
Running it
So now all I have to do, is to checkout the project and start it in my eclipse or intellij:
 Now I go to moskito download page: https://www.moskito.org/download.html and download the latest version, start moskito inspect and connect to localhost:9401 (this was the port used in the call to StartMoSKitoInspectBackendForRemote).
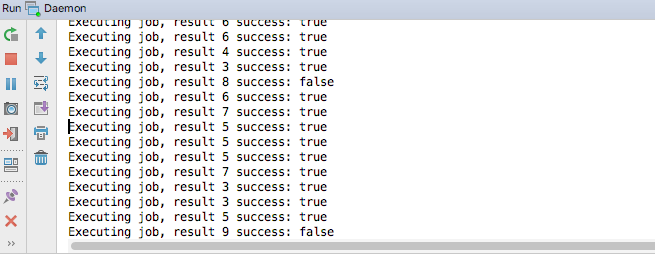
If I go to the counter section, I can see my process already working and counting:

Click on the ProcessCounter leads me to the details:
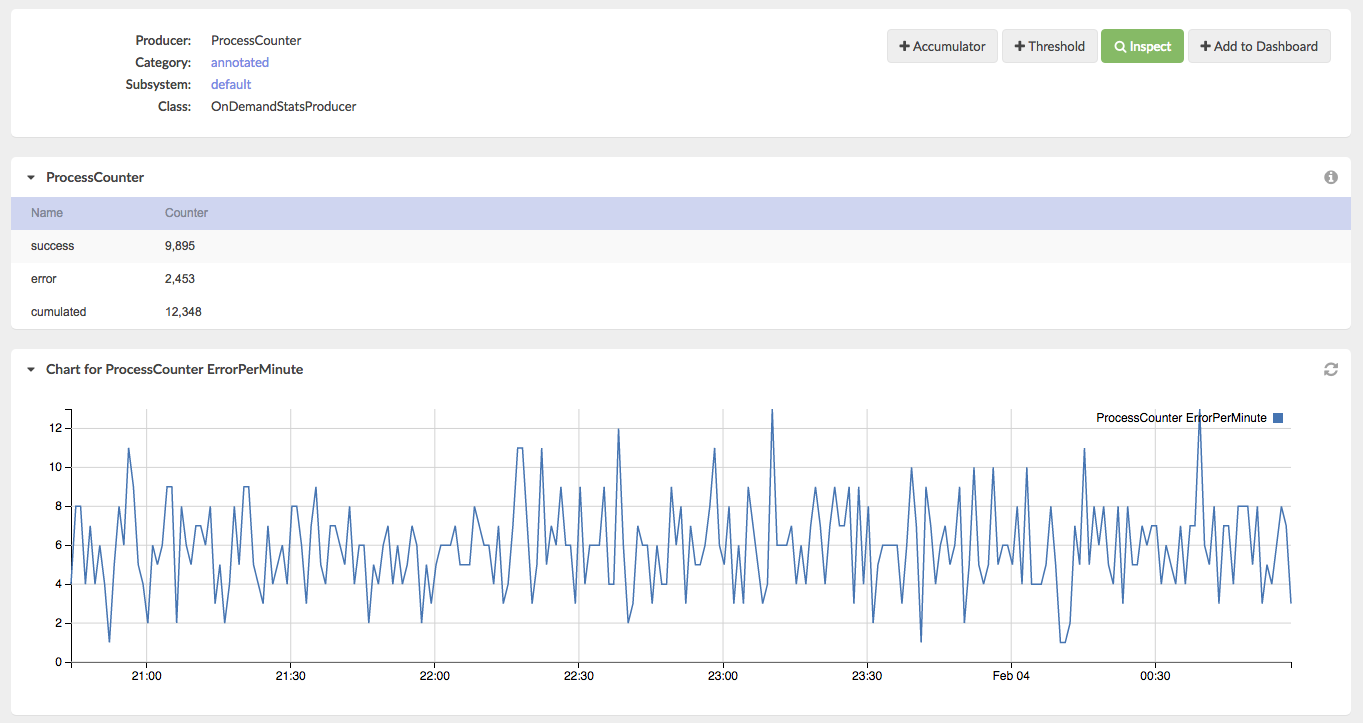
where I can see the success and error rates of my process.
Building a custom dashboard
Now, I am monitoring my process and its running, but I want to be able, to get more control, and build a dashboard. A new dashboard can be built on the fly in moskito-inspect, but to make it restart-safe (and change safe in version control) you have to put it in the config file called moskito.json. There is an example configuration file provided with the demo project.
My Dashboard looks like this:
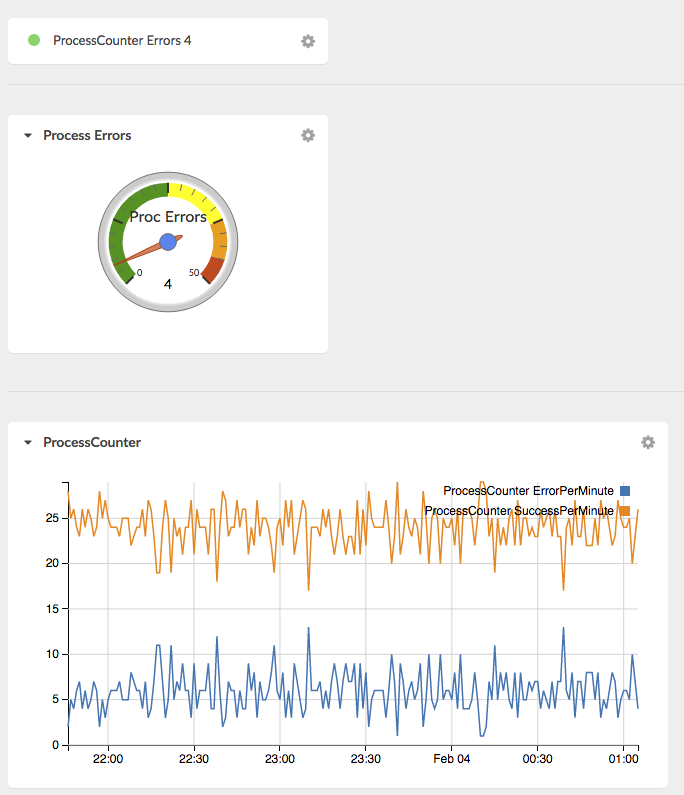 My dashboard contains a threshold, a gauge and a chart. The gauge is just a visual help for me to determine if the current value is ok or not. It is based on the current error count:
      {
        "name": "Proc Errors",
        "caption": "Process Errors",
        "@minValue": {
          "constant": 0
        },
        "@currentValue": {
          "producerName": "ProcessCounter",
          "statName": "error",
          "valueName": "Counter",
          "intervalName": "1m"
        },
        "@maxValue": {
          "constant": 50
        },
Min value is obviously zero; right value is 50 (which I just thought out) and the gauge value is the number of errors in the last minute.
Similar configuration is used for the threshold. I spare you the details, but post a link to the example config file: https://github.com/anotheria/moskito-demo/blob/master/recipes/counter/src/main/resources/moskito.json.
Finally I have to put everything together to a new dashboard:
  "@dashboardsConfig": {
    "@dashboards": [
      {
        "name": "Process Dashboard",
        "refresh": 60,
        "@charts": [
          {
            "caption": "ProcessCounter",
            "accumulators": [
              "ProcessCounter SuccessPerMinute",
              "ProcessCounter ErrorPerMinute"
            ]
          }
        ],
        "@thresholds": [
          "ProcessCounter Errors"
        ],
        "@gauges": [
          "Proc Errors"
        ]
      }

    ]
  },
This is it. My fancy dashboard is ready, and everyone in the company knows how the process is running.
One more thing
There is one more thing to mention, the original inquiry asked, if it’s possible to make a counter without annotation processing. Also annotation-based counters are really easy (basically just a shell of a real class), if you don’t want to use aop, for whatever reasons, you don’t have to. You can build it yourself also. We included an example of self-built counter in this recipe:
public class SelfMadeCounter {

	private OnDemandStatsProducer<CounterStats> producer;

	public SelfMadeCounter(){
		producer = new EntryCountLimitedOnDemandStatsProducer<>("ProcessCounter", "default", "default", CounterStatsFactory.DEFAULT_INSTANCE, 10);
		ProducerRegistryFactory.getProducerRegistryInstance().registerProducer(producer);
	}

	public void success(){
		try {
			producer.getStats("success").inc();
			producer.getDefaultStats().inc();
		}catch(OnDemandStatsProducerException e){
			//won't happen, cause we only use 2 stats.
		}
	}

	public void error(){
		try {
			producer.getStats("error").inc();
			producer.getDefaultStats().inc();
		}catch(OnDemandStatsProducerException e){
			//won't happen, cause we only use 2 stats.
		}
	}
}
just replace the initialisation of the Counter to SelfMadeCounter in the Job class and you are done.
So, enjoy counting your process’s errors, and, more important, successes!